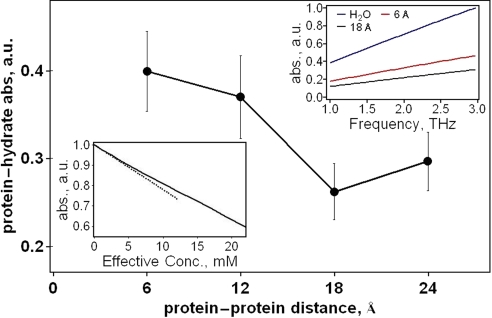
Fig. 2.
THz absorbance of protein and first hydration layer plotted against distance between the protein surfaces is nonmonotonic. (Upper Right Inset) Frequency dependence of the protein-hydration layer absorbance at low (6 Å) and high (18 Å) protein–protein separation, together with the absorbance computed for the same volume of bulk water. (Lower Left Inset) Total computed THz absorption against effective concentration of protein. The quasi-linear region at large protein concentration (>15 mM) reproduces the known behavior, and the nonlinearity at small protein concentration matches the experimental trend measured here (the dashed line is the linear fit to the low concentration trend).

