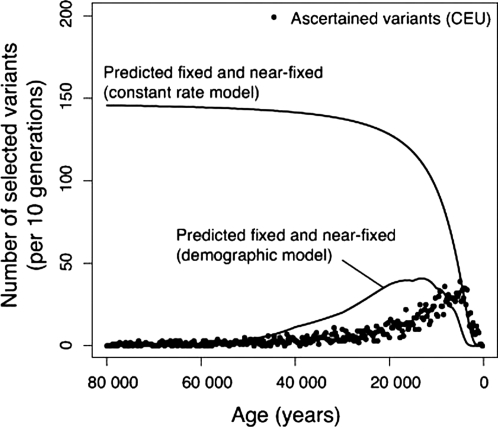
Fig. 3.
Tip of the iceberg. Both the demographic and constant-rate models can account for the age distribution of ascertained variants (CEU data shown), but they differ greatly in the expected number of variants above the ascertainment frequency (fixed or near-fixed). The demographic model predicts a low long-term substitution rate and few alleles >78%, consistent with the observed data.

