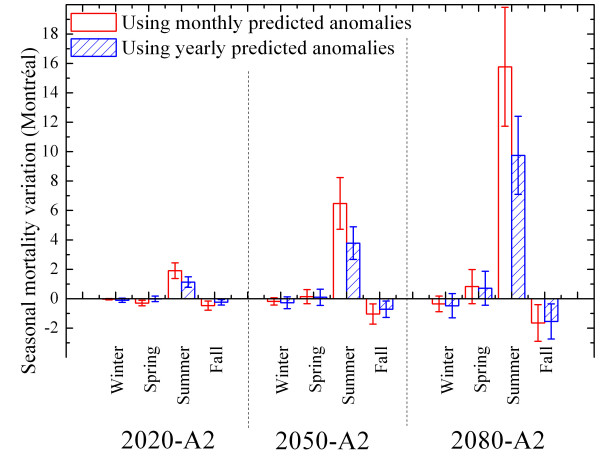
Figure 3.
Seasonal mortality projections under scenario A2 for Montréal using monthly and yearly future simulated temperature anomalies. Seasonal mortality variations are presented for the city of Montréal. These variations are estimated using future temperature data obtained by adding monthly or yearly simulated temperature anomalies (A2 scenario) to historical data. Monthly or yearly temperature anomalies lead to different variations since the mortality-temperature relationship is nonlinear. Mortality variations are expressed as a fraction of the average historical mortality from 1981 to 1999. Confidence bands (95%) are illustrated with the vertical lines.

