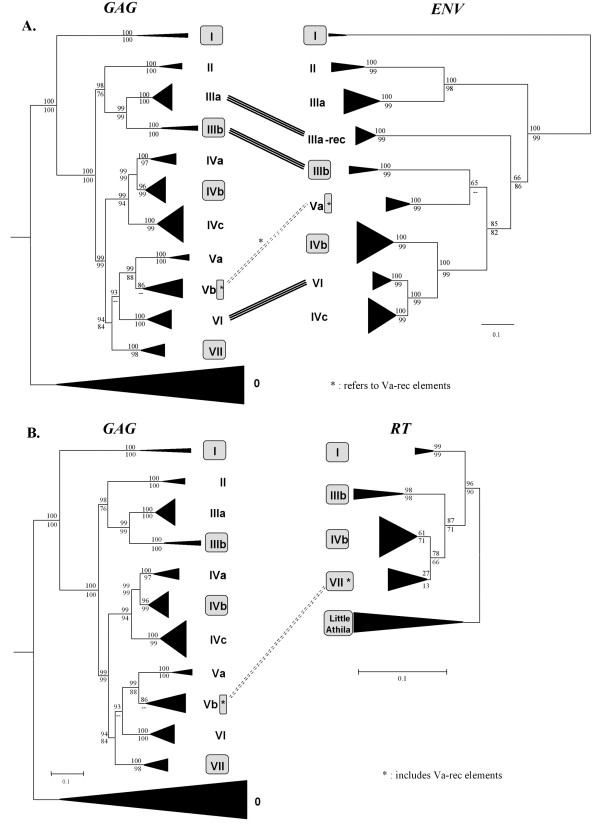
Figure 4.
Comparisons of the phylogenetic trees obtained using different Athila coding sequences. A) Comparison of the Gag and Env trees. Lines connecting both trees indicate different relative positions of families or elements, corresponding to recombination events. The dashed lines refer to the recombination event that generated the Va-rec elements. Bootstrap support for the topology is shown in percentages (Top: neighbor-joining; Bottom: maximum parsimony). In gray boxes, we show the families that contain pol sequences. B) Comparison of the Gag and RT trees.

