
Figure 1.
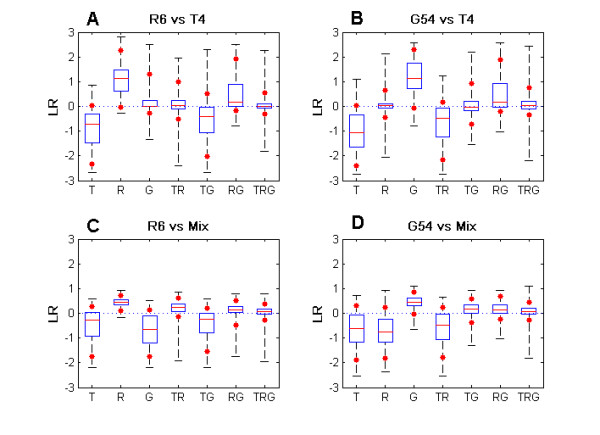
Boxplot of LR values for different spot classes. The limits of the central box represent the 1st and 3rd quartile. The line in the middle of the box marks the median. The lines in the ends of vertical broken lines represent minimum and maximum LR values observed. The stars along the broken lines indicate the 5th and 95th percentiles.