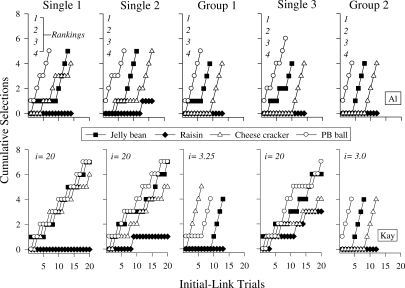
Figure 1.
Cumulative selections across trials and relative rankings of food items are displayed for Al in the top panel. These data illustrate an example of a child whose preference hierarchy did not change during the entire assessment. The bottom panel shows cumulative selections across trials and indifference scores for Kay. Indifference scores describe the amount of selection variability within each assessment. These data illustrate an example of a child with highly indifferent responding during the single assessments and highly discriminated responding during the group assessments.

