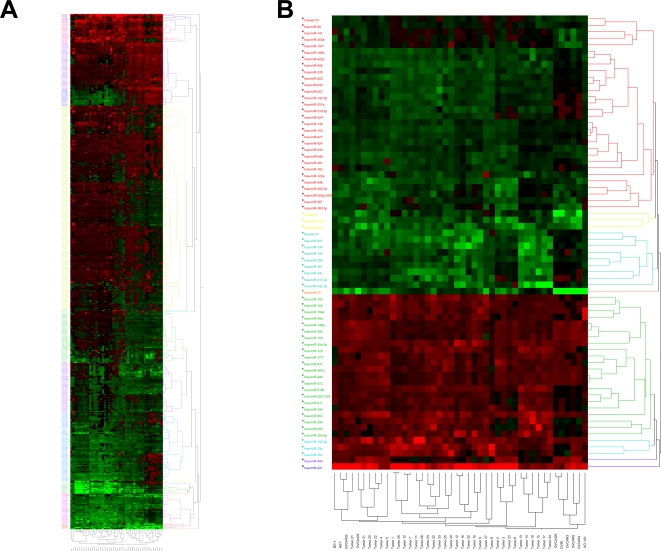
Figure 1. Cluster analysis of miRNA expression.
Tree generated by cluster analysis of ovarian cancer tissues and cell lines based on (A) all tested miRNAs in tissues and cell lines, and (B) differentially regulated miRNAs (Fold change >2.0 or <0.5 in greater than 60% of the samples) in tissues and cell lines compared to the normal control HOSE-B cells.

