Figure 1.

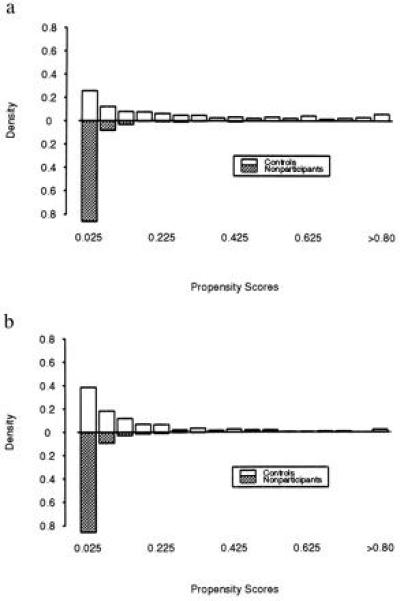
(a) Density of estimated propensity scores for adult male controls and eligible nonparticipants. (b) Density of estimated propensity scores for adult female controls and eligible nonparticipants.

(a) Density of estimated propensity scores for adult male controls and eligible nonparticipants. (b) Density of estimated propensity scores for adult female controls and eligible nonparticipants.