
Figure 3.
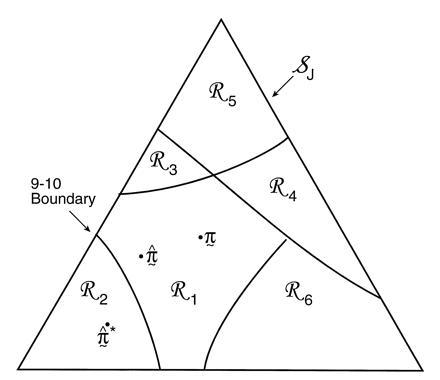
Schematic diagram of tree estimation; triangle
represents the space of all possible ˜π
vectors in the multinomial probability model; regions
ℛ1, ℛ2. . . correspond to the different
possible trees. In the case shown ˜π and
˜π̂ lie in the same region so TREE =
 , but
˜π̂* lies in a region where
, but
˜π̂* lies in a region where
 * does not have the 9-10 clade.