
Figure 5.
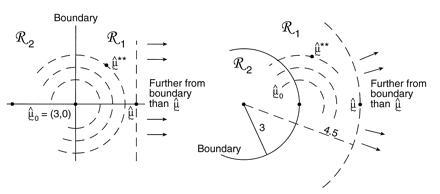
Confidence levels of the two cases in Fig. 4; μ̂0 = (3, 0) is the closest point to μ̂ = (4.5, 0) on the boundary separating ℛ1 from ℛ2; bootstrap vector μ̂** ∼ N2(μ̂0, I). The confidence level α̂ is the probability that μ̂** is closer than μ̂ to the boundary.