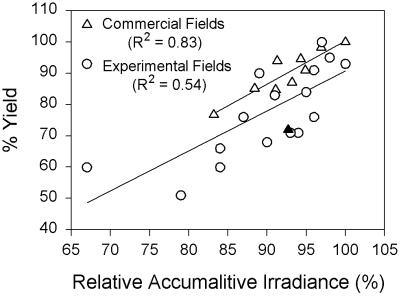
Figure 5.
Scatterplots of measured yields of rice cultivated in Texas as a function of accumulated surface solar irradiance received during a 40-day critical sunlight-requiring period for rice beginning with panicle differentiation and ending 10 days before maturity. The triangles represent annual data from commercial fields in Orange and Jefferson Counties cultivated with rice from 1964 to 1973. The closed triangle is the datum obtained in 1969, a year with adverse weather conditions; this datum was not included in the calculation of the indicated R2 value. The circles represent annual data obtained from experimental fields in Texas cultivated from 1963 to 1967 with varying planting dates. For the commercial-field data, 100% accumulated solar irradiance is equal to 1.3 × 10⁸ J⋅m−2 (and was observed in 1971) and 100% yield is equal to 4,784 kg⋅ha−1 (and was observed in 1971). For the experimental-field data, 100% accumulated irradiance is equal to 1.6 ×10⁸ J⋅m−2 (and was observed in one of three fields tested in 1964) and 100% yield is equal to 5,988 kg⋅ha−1 (and was observed in one of three fields tested in 1965). Data are taken from Stansel and Huke (15).

