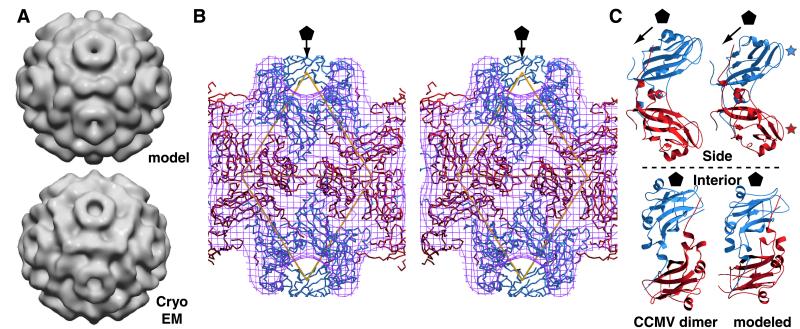
Figure 6.
(A) Surface views of modeled (Upper) and reconstructed (Lower) 65S VLP electron density. The density map of the model was computed to 25-Å resolution; the 65S VLP reconstruction is as in Fig. 4B. (B) Stereo image of modeled 65S VLP subunits fitted within the cryoEM density map. Subunits are colored as in Fig. 5. The outer envelope of the cryoEM density map is represented as a purple mesh, and the fivefold axis is indicated by a pentagon. Asymmetric units are indicated by yellow triangles. Note B/B subunit interactions around twofold and threefold axes. (C) Ribbon diagrams of A/B dimers from CCMV (Left) and the modeled 65S VLP dimer (Right). The upper images represent views tangential to the particle surfaces. Blue and red stars indicate exterior loops of A and B subunits, respectively. The lower images represent views from the particle centers.

