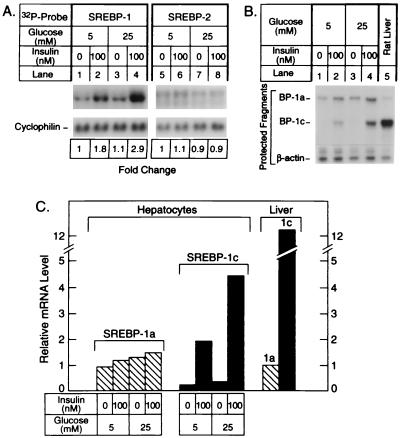
Figure 4.
(A) Amounts of mRNAs for total SREBP-1 (lanes 1–4) and SREBP-2 (lanes 5–8) in rat hepatocytes incubated with low or high glucose with or without INS. Hepatocytes were isolated from rat livers and incubated for 16 h with Medium 199 with Earle’s salts (5 mM glucose) containing 100 nM dexamethasone, 1 nM INS, 100 nM triiodothyronine, and antibiotics as described in Materials and Methods. The cell monolayers were then incubated for 6 h in the same medium containing the indicated concentration of INS and glucose. The cells were homogenized, and aliquots of total RNA (10 μg) were subjected to blot hybridization as described in the legend to Fig. 2. (B) Relative amounts of mRNAs for SREBP-1a and -1c as measured by RNase protection. Aliquots of total RNA were isolated from the hepatocytes and subjected to the RNase protection assay as described in the legend to Fig. 3 (lanes 1–4). As a control, a 10-μg aliquot of total RNA pooled from the livers of four ad libitum-fed male Sprague–Dawley rats was used (lane 5). (C) Quantification of mRNAs for SREBP-1a and -1c. The data from B were quantified as described in Materials and Methods and normalized relative to the β-actin signal. The data for SREBP-1a and -1c mRNA are plotted as the -fold change relative to the SREBP-1a mRNA level in rat liver.

