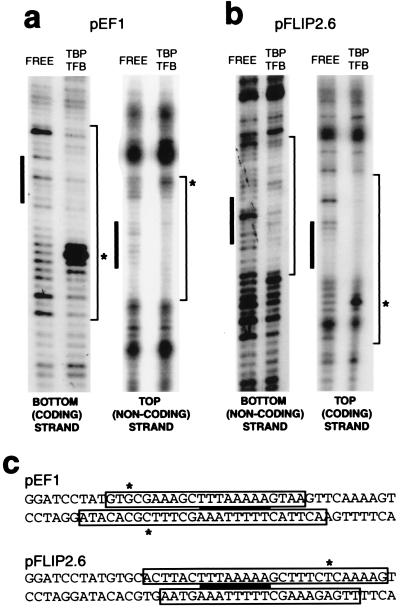
Figure 3.
Polarity is defined at the level of ternary complex formation. (a) DNase I footprinting of TBP/TFBc complex on pEF1. Reaction mixtures contained free probe or 50 ng of TBP and 50 ng of TFBc where indicated. The TATA box is shown by a filled rectangle, and protected sequences are indicated at the right of each gel. Asterisks indicate protein-induced hypersensitivity to DNase I cleavage. (b) DNase I footprinting as in a on pFLIP2.6. (c) Summary of DNase I footprinting data. The sequences of the inserts in pEF1 and pFLIP2.6 are shown with the regions protected from DNase I cleavage boxed. The TATA box is indicated by a solid black bar. Sites of protein-induced hypersensitivities are indicated by asterisks.

