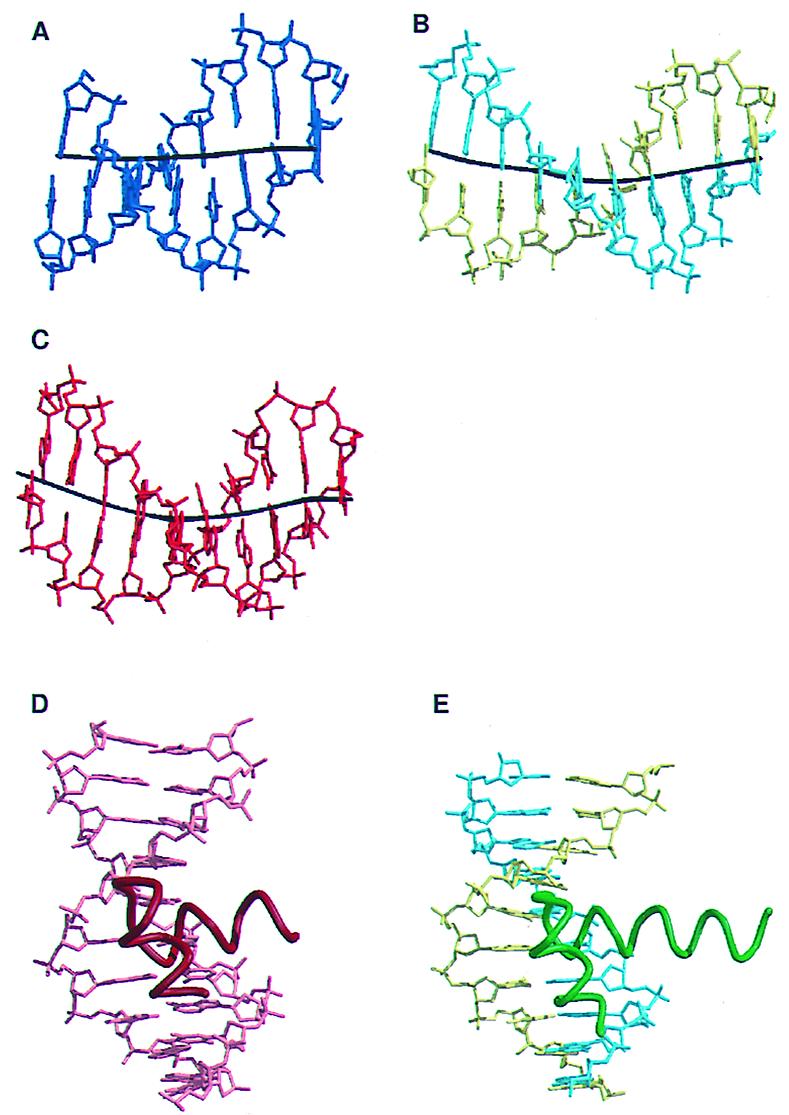
Figure 4.

Comparison to other HTH protein/DNA complexes. (A) A stick diagram of the downstream DNA from the previously determined structure of the TBP/TFBc/DNA complex. (B) A stick diagram of the upstream DNA from the current structure of the TBP/TFBc/DNA complex. (C) A stick diagram of the DNA from the PU.1/DNA complex (30). PU.1 is a member of the ETS winged HTH DNA-binding domains. In A, B, and C, the helical axes of the DNAs are shown as black lines. The PU.1 DNA and the upstream DNA from the current structure show the bend typical of HTH-bound DNA, whereas the downstream DNA from the previous determined structure of the archaeal TBP/TFBc/promoter complex is straighter. (D) The HTH and DNA from the λ repressor/operator complex (31). (E) The HTH and upstream DNA from the current TBP/TFBc/DNA complex. In D and E the DNAs are shown as stick figures and the HTHs are shown as coils.
