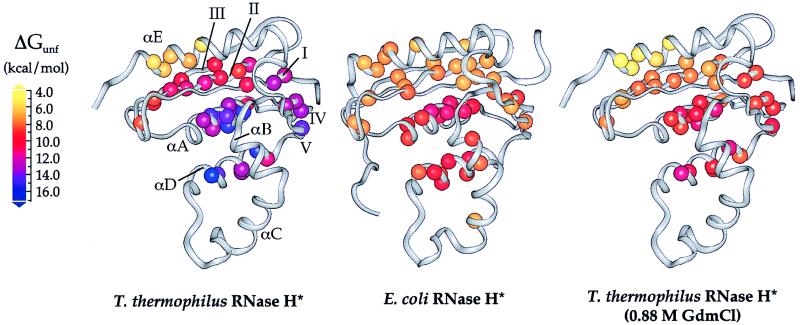
Figure 2.
Free energies of unfolding for residues in T. thermophilus and E. coli RNases H* mapped onto the x-ray crystal structures (9, 23). Data for E. coli RNase H* were obtained from Chamberlain et al. (6). Each sphere represents a backbone amide site for which hydrogen exchange rates could be measured; these spheres are colored according to their ΔGunf values. Stabilities in 0.88 M GdmCl are shown for T. thermophilus RNase H*, as this is where the highest regional ΔGunf is the same as that for E. coli RNase H* in the absence of denaturant; these values were calculated by using ΔGunf and m-values from Table 1.

