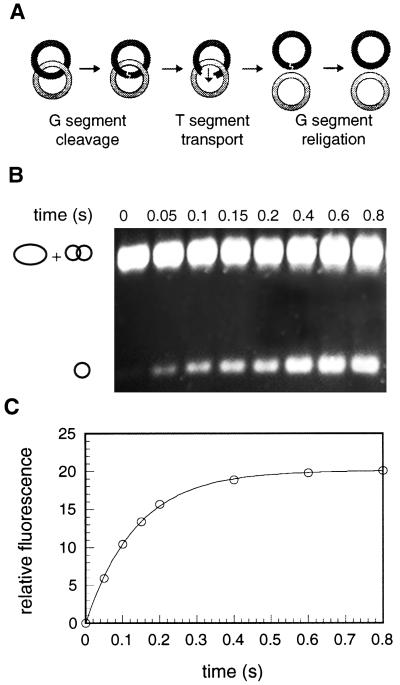
Figure 1.
Single turnover decatenation measured in the millisecond time scale. (A) Schematic of the reaction showing the three steps of decatenation: G segment cleavage, T segment transport, and G segment religation. The singly linked double-strand catenanes used in the reactions are supercoiled, but shown as relaxed for clarity. (B) A decatenation reaction time course with 50 nM wt topoisomerase II and 25 nM DNA was started by rapid addition of ATP (1 mM, final). After times varying from 50 to 800 msec, reactions were quenched and analyzed by ethidium bromide-stained agarose gel electrophoresis, as described in Materials and Methods. (C) The results shown in B were quantified and fit to the single exponential equation A(1 − e−Bt). Although the data shown were from the single integration shown in B, the rate constant of 6.5 ± 0.8 s−1 was determined for this reaction from three different integrations of the bands.

