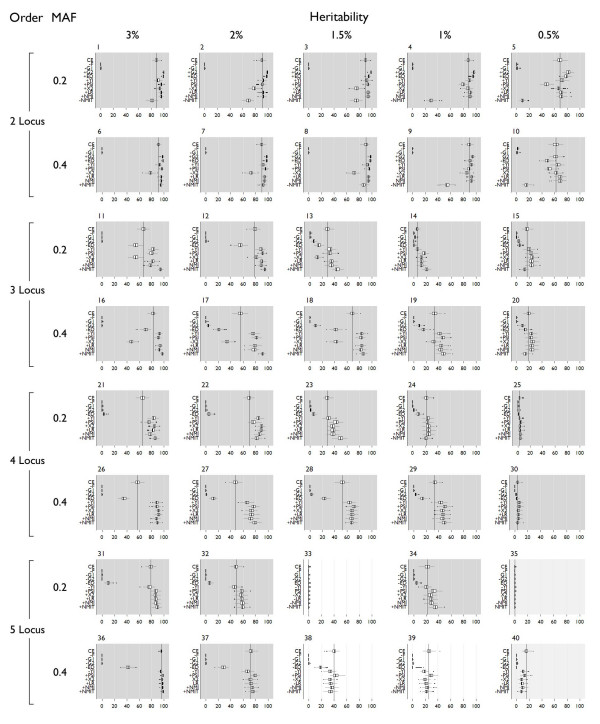
Figure 4.
Specific detection box plots. The dark vertical line indicates the mean detection using classification error. Dark shading indicates LR and NMI were significantly better, medium shading indicates no significant difference. Light shading indicates classification error was better than LR and NMI. "+" on the y axis indicates significantly different from classification error with a higher mean, "-" indicates significantly different from classification error with a lower mean. Significance was assigned by Wilcoxon rank-sum tests.

