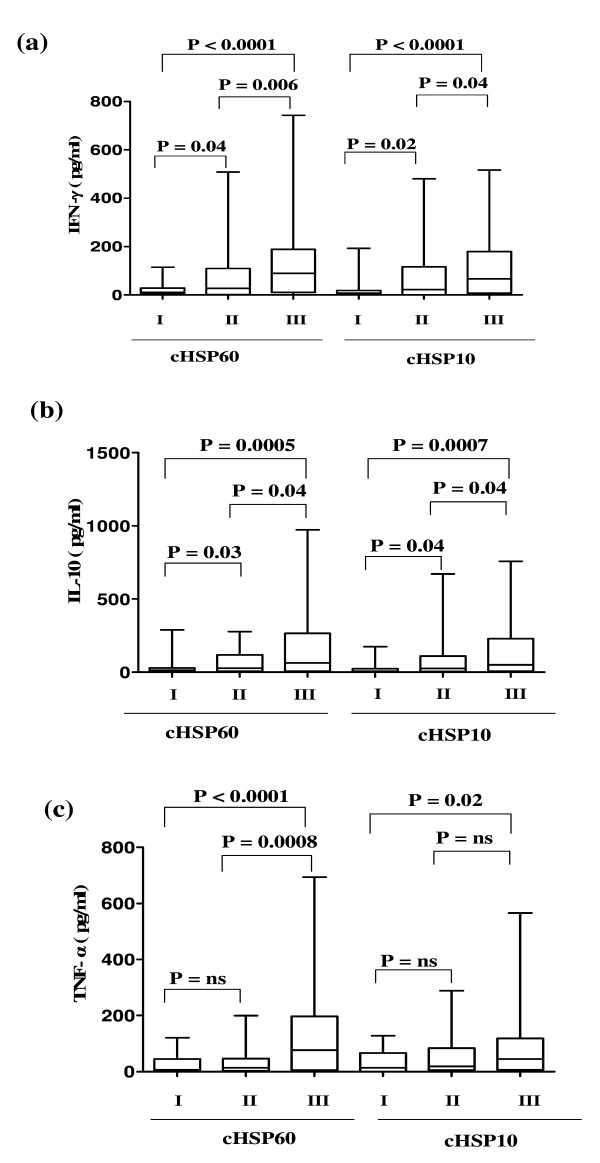
Figure 2.
Cytokine concentrations after stimulation with cHSP60 and cHSP10. Box plot representing concentrations of (a) IFN-γ (b) IL-10 (c) TNF-α in supernatants of cervical mononuclear cells after stimulation with cHSP60 and cHSP10. A significant increase in levels of IFN-γ, IL-10 and TNF-α was observed after stimulation with cHSP60 and increased IFN-γ and IL-10 levels were observed after stimulation with cHSP10 in Group III as compared to Group I and Group II. The horizontal line in the middle of the box is the median value of the responses and the lower (upper) is the 25th (75th) percentile. I, II and III represent Group I, Group II and Group III respectively where, Group I (n = 39) – Healthy women with no infertility problem. Group II (n = 63) – Chlamydia positive women with no infertility problem. Group III (n = 70) – Chlamydia positive women with infertility. ns – Not significant. Mann-Whitney U-test was used for comparing two groups

