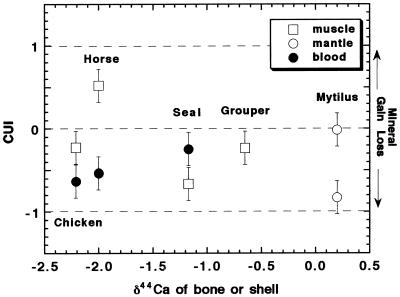
Figure 4.
The CUI, calculated from calcium isotopic data (Table 1 and Eq. 7), plotted versus the δ44Ca of bone or shell of the organism. A separate value of the CUI is calculated for muscle and blood for each organism where data are available. The CUI values are assigned an uncertainty of ±0.2, which is approximate.

