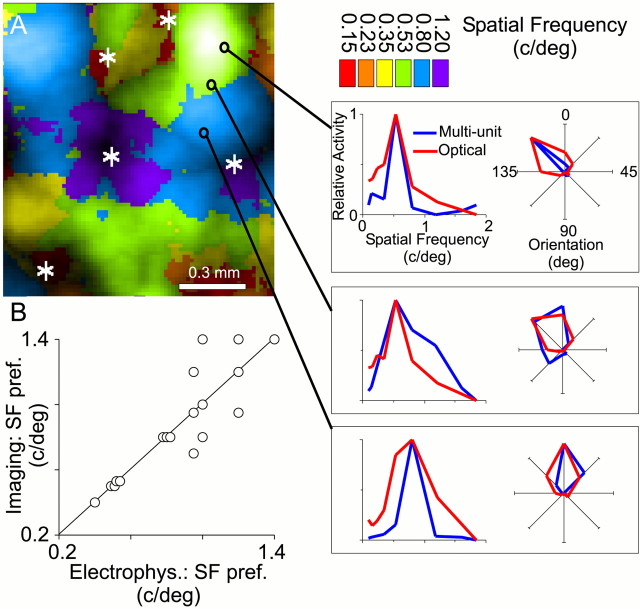
Fig. 3.
Multi-unit recordings validate spatial frequency maps. A, Microelectrode penetrations were targeted to specific SF domains in area 17. Microelectrode penetrations were made at the locations marked by black circles on the SF response map. In the optical and electrophysiological tuning curves, relative activity is plotted as a function of SF (line graph) and orientation (polar plot); for each tuning curve, the maximum response was set to a value of 1, and the minimum response was set to 0. Note that the penetrations shown are in “intermediate” SF domains (between 0.3 and 0.8 c/°). Orientation pinwheel centers are marked with asterisks. B, Preferred SF derived from optical maps plotted against preferred SF measured from unit recording. To show each data point, points that overly each other have been plotted adjacent to each other. A linear fit had a correlation coefficient r = 0.86 for 19 cells. The mean difference in orientation preference between optical and electrophysiological measurements was 4.2 ± 3.3° (mean ± SD). Scales are linear.

