. 2000 Nov 15;20(22):8504–8514. doi: 10.1523/JNEUROSCI.20-22-08504.2000

Fig. 4.

Fig. 4.

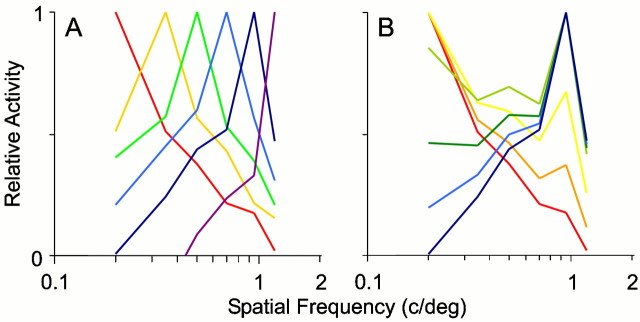
Intermediate SF domains are independent of neighboring high and low SF domains. A, Average tuning curves at each SF peak for the SF map shown in Figure 2. Average tuning curves were constructed after first normalizing the response at each pixel such that 1 represents the maximum response of a pixel, and 0 represents the theoretical response of the cortex to a blank image. Tuning curves from all pixels that had the same peak SF preference and those whose peak response exceeded the 2ς noise level were averaged to give the tuning curves shown. The abscissa is a logarithmic axis. B, Hypothetical SF tuning curves, constructed from the linear summation of high and low SF domains, do not match the observed SF tuning curves. The hypothetical tuning curves were constructed by adding together weighted tuning curves from high and low SF domains:
tuning curve (f,SF)=TC0.2(SF)·f+TC0.95(SF)·(1f).
The weighting factor, f, varied from 0 to 1; each curve has a different value of f. TC0.2was the tuning curve measured for pixels with a best response at 0.2 c/° (red curve in A), and TC0.95 was the tuning curve measured for pixels with a best response of 0.95 c/° (purple curve inA).