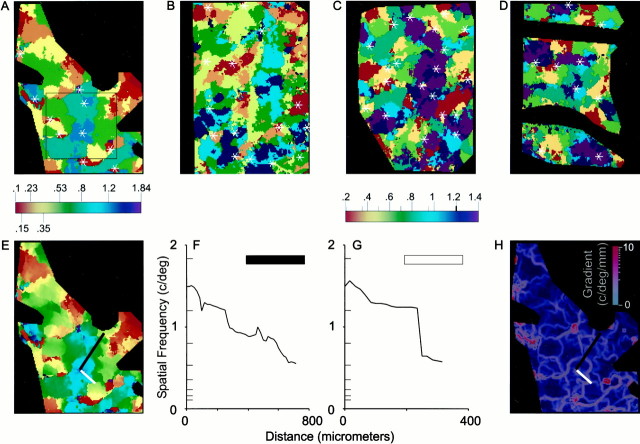
Fig. 5.
SF maps show linear discontinuities.A, An SF map produced in response to the eight SF stimuli marked on the color bar below thepanel; the SF scale shown on this color bar is shared with E. Orientation pinwheel centers are marked with asterisks inA–D. The area marked by a square is shown rotated in Figure 3. B–D, The SF map inB was produced in response to six SFs (0.2, 0.35, 0.5, 0.7, 0.95, and 1.2), marked with short lines on thesecond color bar. The SF maps in C andD were produced in response to the seven SFs marked on the second color bar. E, The interpolated SF map constructed from the same data used to make the SF map inA. F, Spatial frequency profile along the transect marked by the black line in Eand H. SF preference varies smoothly over this region.G, Spatial frequency profile along the transect marked by the white line in E andH. SF preference varies continuously over the initial segment of this transect but shifts at a fracture in the SF map.H, Spatial gradient of SF preference. Pixels at which SF preference varies rapidly are shown in red. Areas in which the spatial gradient is small are shown inblue.

