
Fig. 5.
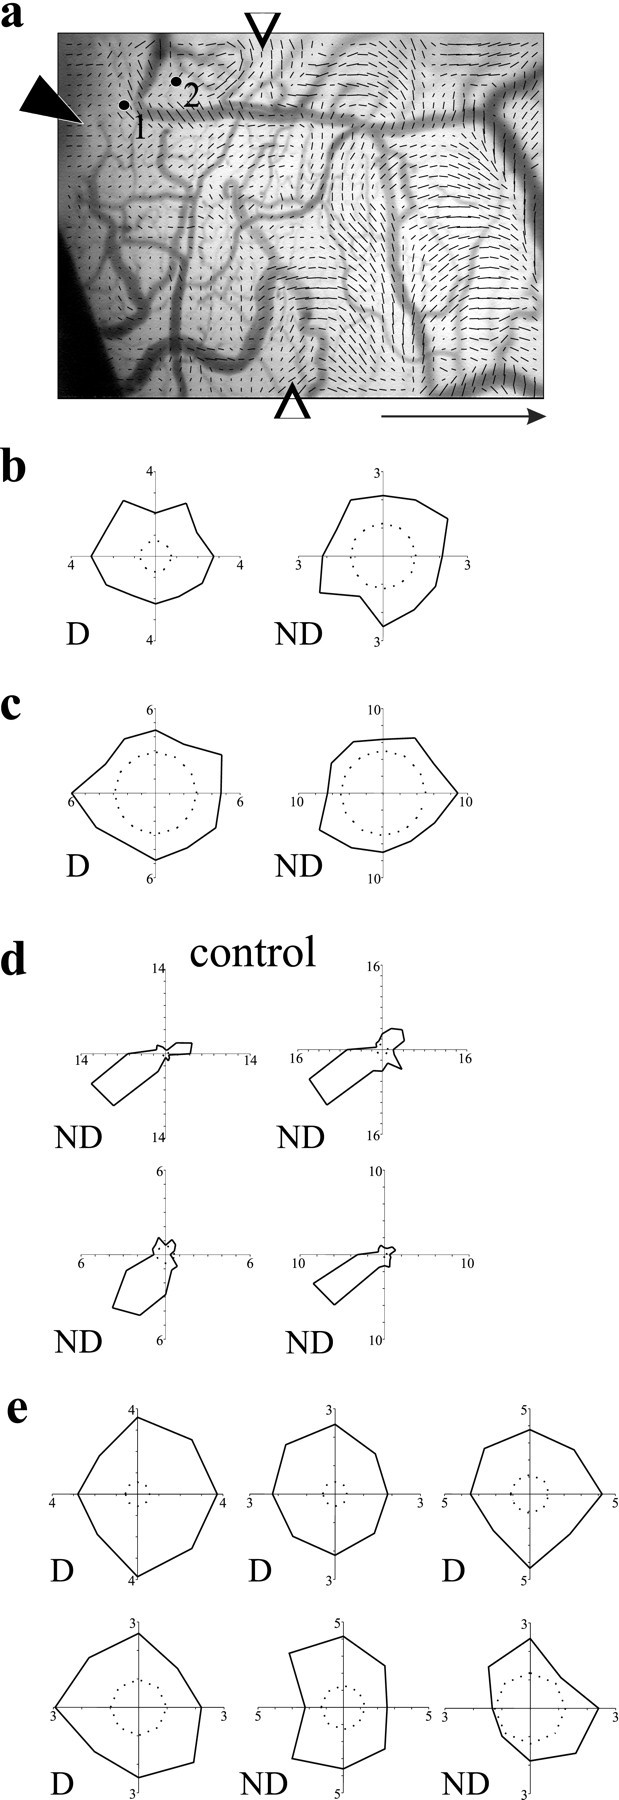
Orientation selectivity of individual cortical neurons is affected by NT-4/5 infusion. a, Cortical surface of imaged area, showing position of cannula and sites of penetrations 1 and 2, overlaid by vector polar map showing extent of effect (open arrows). Average visual responsiveness in area near cannula that was affected by NT-4/5 is 2.0 · 10−4; visual response in the control area of the same image is 3.1 · 10−4.b, Polar plots of firing rate at 12 orientations for a cell encountered along penetration 1, through both deprived (D) and nondeprived (ND) eyes. Polar plots are constructed from vectors whose orientation indicates the stimulus orientation and whose magnitude shows the response to that stimulus orientation.c, Polar plots of orientation tuning for a cell recorded along penetration 2, through deprived and nondeprived eyes.d, Polar plots of orientation tuning for four cells recorded in control cortex; all responded to stimulation only through the nondeprived eye. e, Polar plots of orientation tuning of individual cortical neurons in another animal, close to the NT-4/5 cannula, for eight stimulus orientations. Inner dashed circles indicate baseline spontaneous activity. Scale bararrow: 1 mm, points to anterior