Fig. 2.

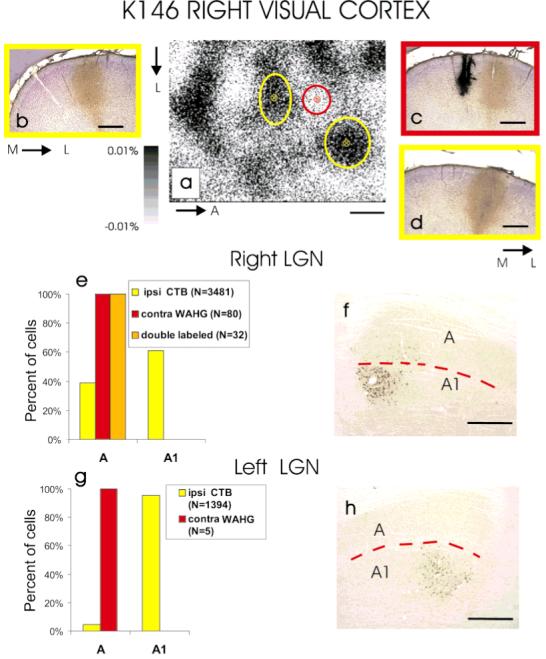
Retrograde labeling in the lateral geniculate nucleus (LGN) of an adult cat after targeted tracer injections into the right and left eye ocular dominance patches. a: Optical image of intrinsic signals from a 3.2 × 2.4 mm area of the right visual cortex showing clear ocular dominance (OD) patches activated through the contralateral (white areas) and ipsilateral (dark areas) eyes. A wheat germ apo-horseradish peroxidase gold (WAHG) injection (red ellipse on the optical image a, and c) and two cholera toxin B (CTB) injections (yellow ellipses on the optical image a, and b,d) were targeted to the contralateral and ipsilateral eye OD patches, respectively. The size of the ellipses centered at each injection site indicates the spread of the tracer as assessed histologically. b-d: Coronal sections through the lateral gyrus showing the spread of the tracers at the injection sites. e: Laminar distribution of retrogradely labeled neurons in the right LGN. Note that WAHG labeled neurons are restricted to lamina A, consistent with the small injection site in the cortex (red ellipse on the optical OD map a, and c). Because of the spread of the CTB at the injection sites (yellow ellipses in the optical OD map a, and b,d), the CTB-labeled neurons in the LGN are not restricted to lamina A1 (e,f). g,h: In the left hemisphere, the injected tracers were confined to eye-specific OD columns and retrogradely labeled neurons were restricted to the appropriate LGN lamina. M, medial, L, lateral; A, anterior. The red dotted lines in f and h mark the border between LGN laminae A and A1. Scale bars = 500 μm.
