
Fig. 3.
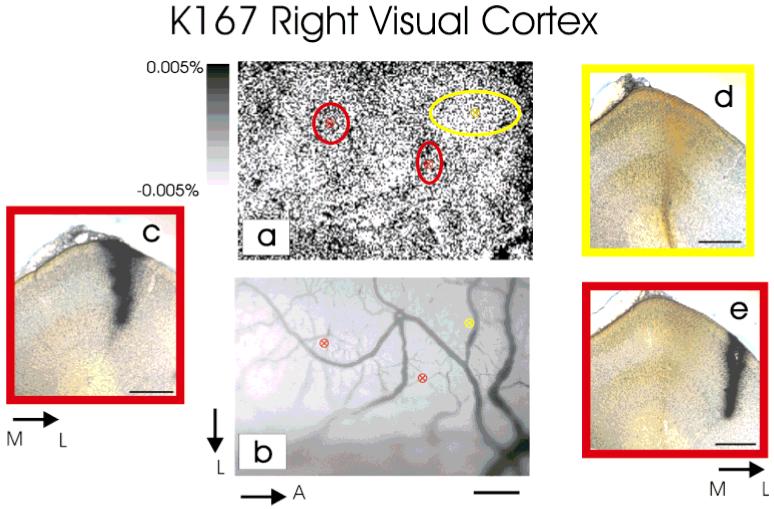
a: Optical image of intrinsic signals in the right visual cortex of a P16 cat. Ocular dominance columns are just emerging at this age, as shown by the faint fluctuations in the optical map. b: Vascular pattern of the imaged area guiding the injections of retrograde tracers. Two injections of wheat germ apo-horseradish peroxidase gold (WAHG) were made into areas that responded preferentially to the ipsilateral eye (a: red ellipses centered onto darker areas; insets c,e), and one injection of cholera toxin B was made into a region responding preferentially to the contralateral eye (a: yellow ellipse centered onto a white area; inset d). In a, the size of the ellipses centered at each injection site indicates the spread of the tracer as assessed histologically. c-e: Coronal sections through the lateral gyrus showing the spread of the tracers at the injection sites. Scale bars = 500 μm for a-e.