
Fig. 2.
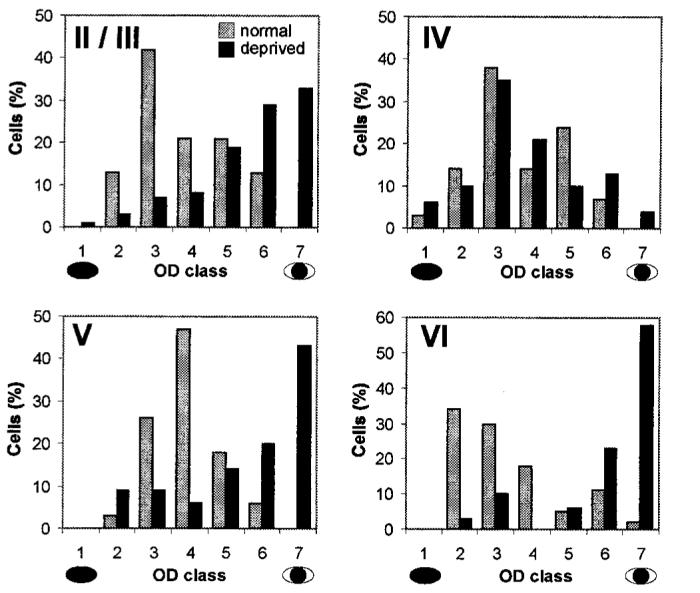
OD histograms constructed from all cells recorded in control (gray bars) and monocularly deprived (black bars) kittens are shown for individual laminae. The laminae are indicated by the number in the top left corner of each histogram. OD scores are as described in Fig. 1. Cells were recorded from both hemispheres and assigned appropriate OD scores. For this analysis, all cells were then rescored as though they had been recorded from the hemisphere contralateral to the deprived eye.