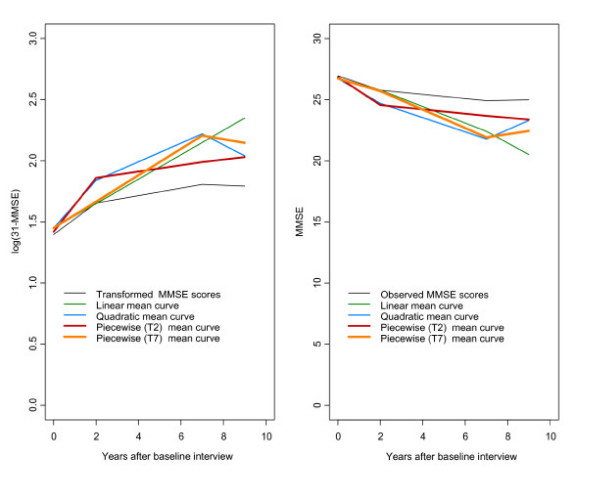
Figure 2.
The plot on the left shows the mean curve of scores obtained after applying the transformation Yit = log(31-MMSEit) to MMSE scores and the mean estimated curves obtained from fitting a linear, a quadratic and two change point models to these transformed scores. On the right, the back-transformed curves are shown.

