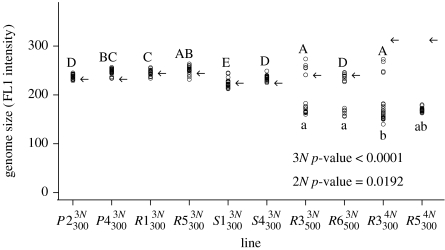
Figure 1.
Variation in genome size measured by flow cytometry. Twenty colonies (circles) were analysed from each line at t=186. Arrows indicate the initial genome sizes of tetraploid- and triploid-sized founder colonies at t=0 (averaged across three colonies). Letters denote significant (p<0.05) genome size differences among evolved triploid-sized lines (uppercase letters) and among the diploid-sized lines (lowercase letters; analysed separately) according to post hoc Tukey tests following significant ANOVA results (p-values in figure).

