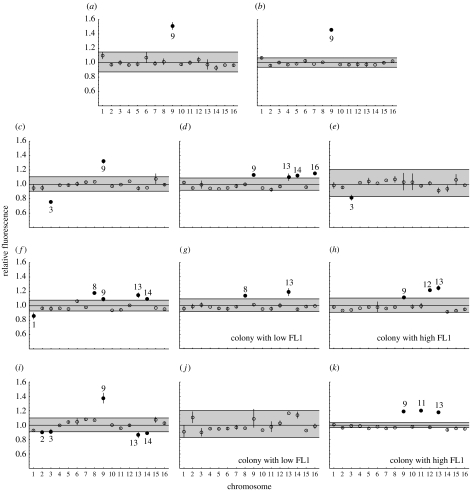
Figure 2.
Fluorescence ratio by chromosome using CGH. Each panel presents the results of two microarrays (dots, mean; bars, range). Euploid lines are expected to have fluorescence ratios (experimental/control) of one. Putative aneuploid chromosomes (solid dots with chromosome numbers) exhibited fluorescence ratios substantially different from one (more than 10%) and fell outside of the rejection region (grey shading). (a) Approximately 1N ancestor, (b) approximately 4N ancestor, (c) approximately 3N at t=0 (), (d) approximately 3N at t=0 (), (e) approximately 3N at t=0 (), (f) approximately 3N at t=0 (), (g) approximately 2N at t=186 (), (h) approximately 2N at t=186 (), (i) approximately 4N at t=0 (), (j) approximately 2N at t=186 () and (k) approximately 2N at t=186 ().

