
Figure 3.
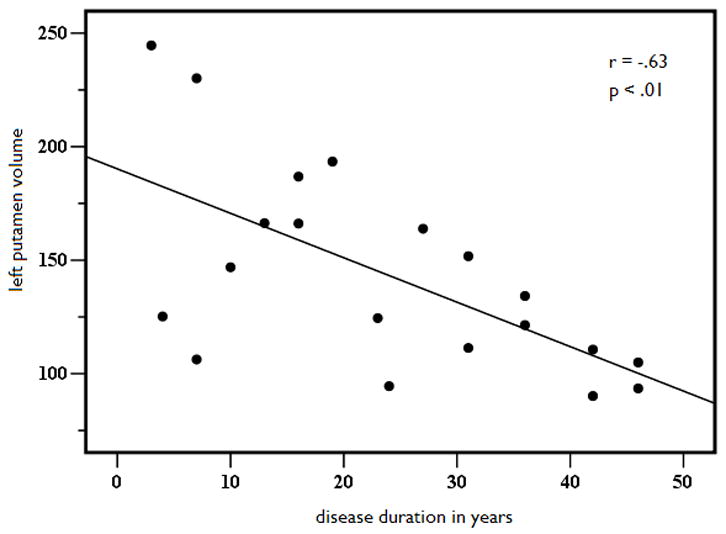
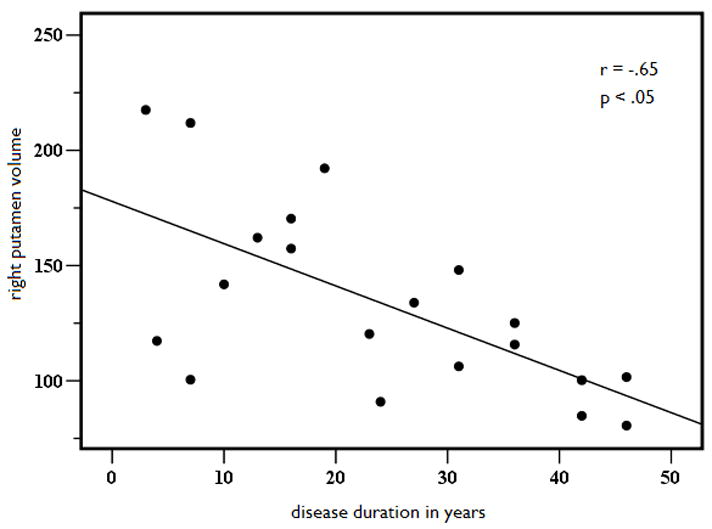
Left (A) and right (B) putamen age and ICV-adjusted putamen volume as a function of disease duration in years in patients with MTLE.
Official websites use .gov
A
.gov website belongs to an official
government organization in the United States.
Secure .gov websites use HTTPS
A lock (
) or https:// means you've safely
connected to the .gov website. Share sensitive
information only on official, secure websites.
Left (A) and right (B) putamen age and ICV-adjusted putamen volume as a function of disease duration in years in patients with MTLE.