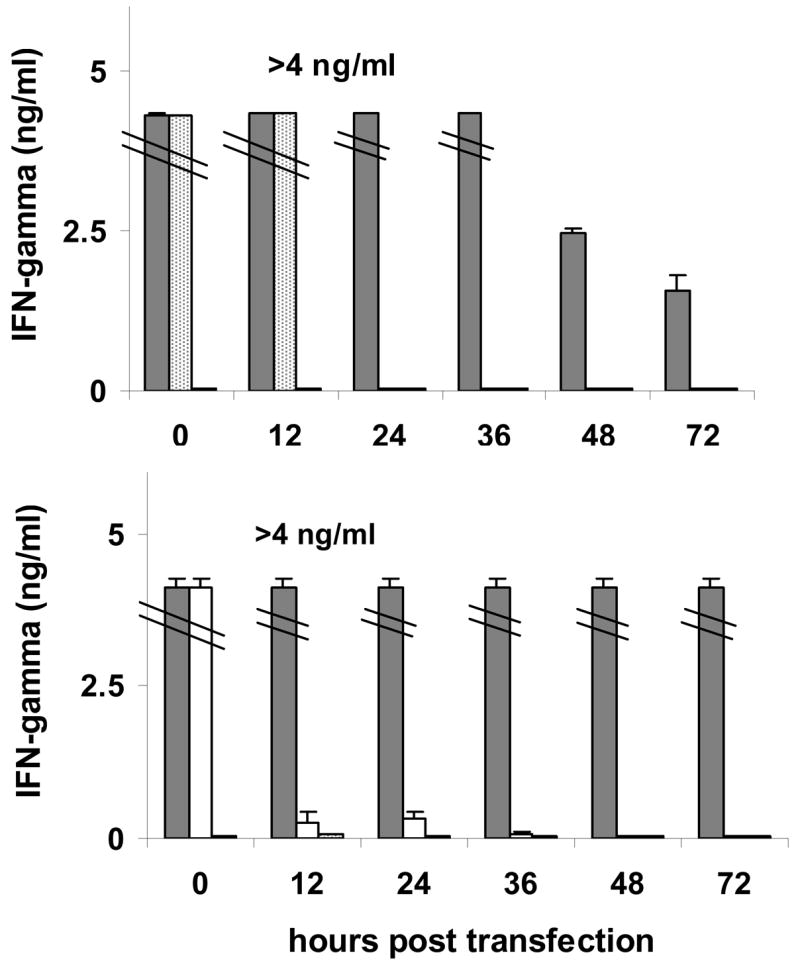
Figure 3. Stimulation of peptide-specific CD8+ T cells following incubation with MEP-mel transfected DC.

Immature DC transfected with MEP-mel (grey bars) and mature DC loaded with gp100–209 (dotted bars) or with mart1–27 (white bars) were used to stimulate a gp100–209 (top) or a mart1–27 (bottom) specific T-cell line. Each time point included two negative controls: GFP (Green Fluorescent Protein)-transfected DC (0–500 pg/ml) and Hepatitis B virus (HBVc:18–26 (23Y)-loaded DC (0–20 pg/ml). Bars represent standard error of the mean of two independent experiments.
