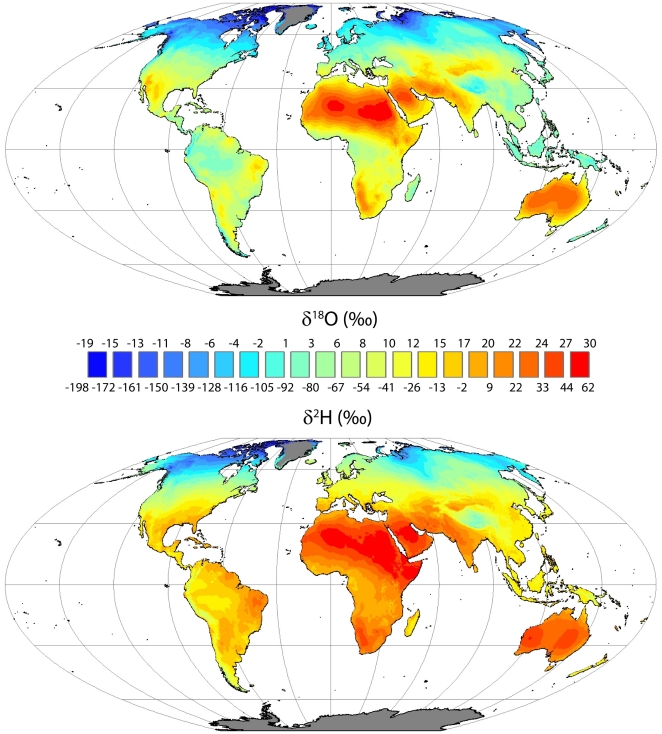
Figure 1. Global mean annual average leaf water δ18O and δ2H isoscapes for the sites of evaporation within leaves (Flat Polar Quartic projection; Two-pool and Péclet models gave similar, less enriched results).
Means were derived from monthly model predictions that utilized input grids of annual average precipitation isotope ratios as plant source water, elevation (for barometric pressure), and modified monthly climate grids for temperature and humidity from the WMO climate normal period (New et al. 2002; see text for details). Grid cells where monthly temperature averages were never above freezing resulted in blank cells (shown as gray).

