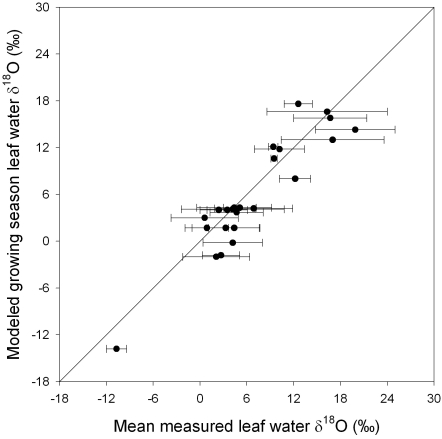
Figure 3. Model comparison with data at known locations.
Each point is a mean of reported values (X-axis; error bars are ±1 s.d. and incorporates diurnal and seasonal variability) versus a growing season average evaporative site leaf water prediction derived from the monthly isoscapes (Y-axis). The diagonal line is the 1∶1 line. Growing seasons were defined as May-July for the northern hemisphere (July–August for northern Canada data point), all months for the tropics, and October–December for the southern hemisphere. There was a significant correlation (R = 0.93) between model predictions and mean leaf water. References for the data sources are provided in Appendix S1.

