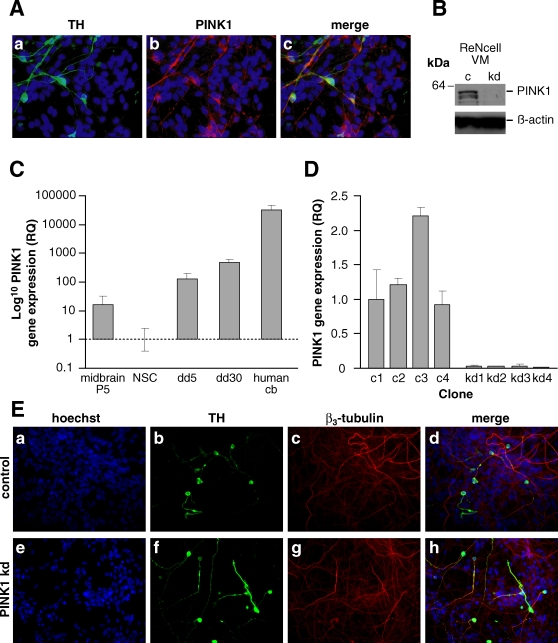
Figure 1. PINK1 Expression & Up-regulation.
A) PINK1 expression in human dopaminergic neurons. Red; PINK1, green; TH, blue; hoescht. B) Western blot showing endogenous PINK1 protein expression in control (c) and PINK1 kd (with 90% mRNA knockdown) human neuronal lysates after 5 days differentiation. Anti-PINK1 (Novus) was used to detect PINK expression; β-actin levels are shown as loading control. C) Histogram showing relative fold change in PINK1 mRNA expression levels between NSCs, 5 day differentiation (dd5), 30 day differentiation (dd30). PINK1 expression levels from pre-immortalised neural stem cells from 8 week old ventral mesencephalon (Midbrain P5) and adult human brain (Human Cb) are shown for comparison. Values represent mean of three replicate samples±s.e.m. D) Histogram showing expression of PINK1 mRNA in human neurons in four control (c1-4) and four PINK1 kd (kd1-4) selected clones relative to an endogenous control gene. RQs were normalised to that of c1; values represent mean of 3 replicate samples±standard error (s.e.m). E) Immunofluorescence images showing dopaminergic cells in control (i) and PINK1 kd (ii) human neuronal cultures after 5 days differentiation. Red; TH, green; βIII tubulin, blue; Hoecsht.

