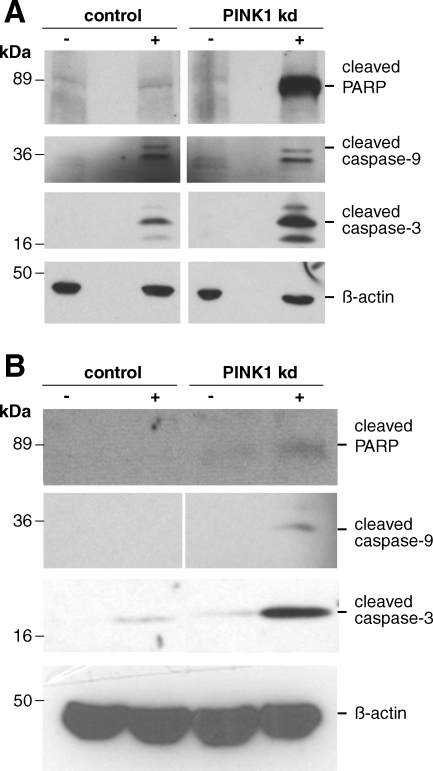
Figure 4. Apoptosis in PINK1 kd human neurons.
Western blots showing increase in basal (−) and STS-induced (+) cleaved caspase 3, cleaved caspase-9 (two bands ∼36 and ∼32 kDa) and cleaved PARP without PINK1 in young (A) (dd5) and aged (B) (dd43) human control and PINK1 kd neuronal cultures. Each lane is a sample from three pooled independent culture lysates. The lowest bands are immunoreactive degradation products which run at the foot of an SDS-PAGE gel.

