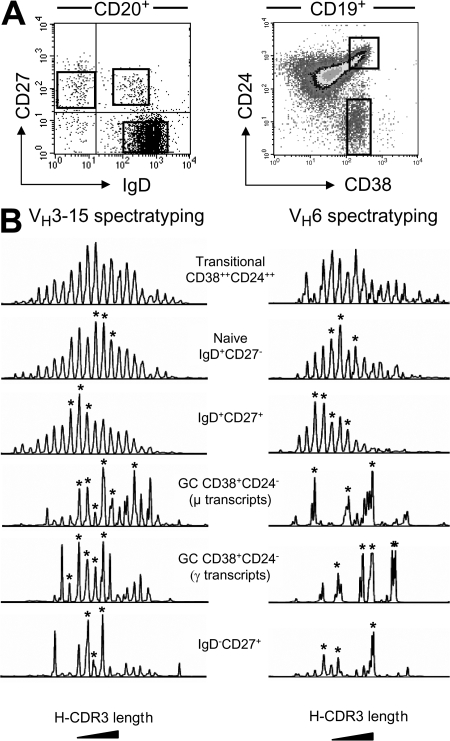
Figure 2.
H-CDR3 spectratypes of the VH3.15 and VH6 transcripts expressed by the splenic B cell subsets of an 8-mo-old child. (A) Two different marker combinations were used to isolate splenic GC (CD19+CD24−CD38+) and transitional B cells (CD19+CD38++CD24++) or naive IgD+CD27+, IgD+CD27+ and switched IgD−CD27+ B cells. (B) Spectratyping was performed on VH3.15 and VH6 μ and/or γ transcripts from each cell fraction, as described in the legend of Fig. 1. Peaks identified by an asterisk were further sequenced to evaluate intrapeak clonal diversity.

