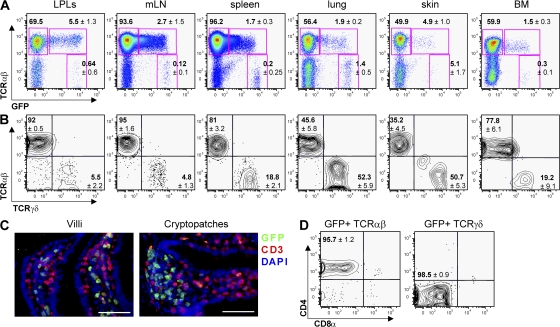
Figure 1.
Diversity and distribution of RORγt+ T cells in vivo. (A and B) Flow cytometry analysis of cells isolated from the organs of 8–12-wk-old Rorc(γt)-GfpTG mice. Plots are gated on CD3+ cells (A) or GFP+ CD3+ cells (B). Numbers indicate mean percent cells in quadrants ± SD obtained with at least three Rorc(γt)-GfpTG mice. LPLs, lamina propria lymphocytes isolated from small intestine; mLN, mesenteric LNs; BM, bone marrow. (C) Immunofluorescence histology of RORγt+ cells in the small intestine of Rorc(γt)-GfpTG mice. Most RORγt+ cells in villi are T cells, whereas RORγt+ cells in cryptopatches located between crypts are CD3− LTi cells. Bar, 50 μm. (D) Expression of CD4 and CD8α by spleen GFP+TCR-β+ and lung or GFP+TCR-δ+ cells.

