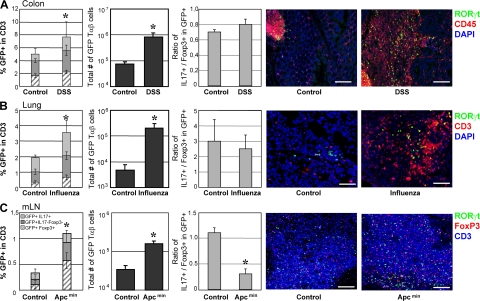
Figure 6.
Equilibrium in RORγt+ T cell subsets during pathology. (A) Rorc(γt)-GfpTG mice were treated with DSS in the drinking water for 6 d, followed by water for 10 d. This protocol was repeated for a total of three cycles. After the last cycle, cells isolated from the colon were restimulated in vitro with PMA/ionomycin for 5 h and subjected to intracellular staining for GFP, IL-17, and Foxp3. Histograms (from left to right) report percent GFP+TCR-β+ cell subsets in total T cells (see Fig. 4 C), total numbers of RORγt+ Tαβ cells present in the organ, and the ratio of IL-17–producing to Foxp3+ cells within RORγt+ Tαβ cells (see Fig. 4 D). Right panels show immunofluorescence histology of a colon from a healthy or a treated Rorc(γt)-GfpTG mouse. Bar, 100 μm. (B) Rorc(γt)-GfpTG mice were infected intranasally with 100 PFUs of influenza A virus for 7 d. Cells were then isolated from the lung and processed as in A. Right panels show immunofluorescence histology of a lung from healthy or an infected Rorc(γt)-GfpTG mouse. Bar, 50 μm. (C) Cells were isolated from the mesenteric LNs of a 4-mo-old Rorc(γt)-GfpTG × Apcmin/+ mouse and processed as in A. Right panels show immunofluorescence histology of a mesenteric LN from a normal or a tumor-bearing mouse. Bar, 100 μm. Data shown are representative of at least three independent experiments. Three to four mice were analyzed per group. *, P < 0.05 as compared with control (mock-treated or WT mice).

