
Figure 6.
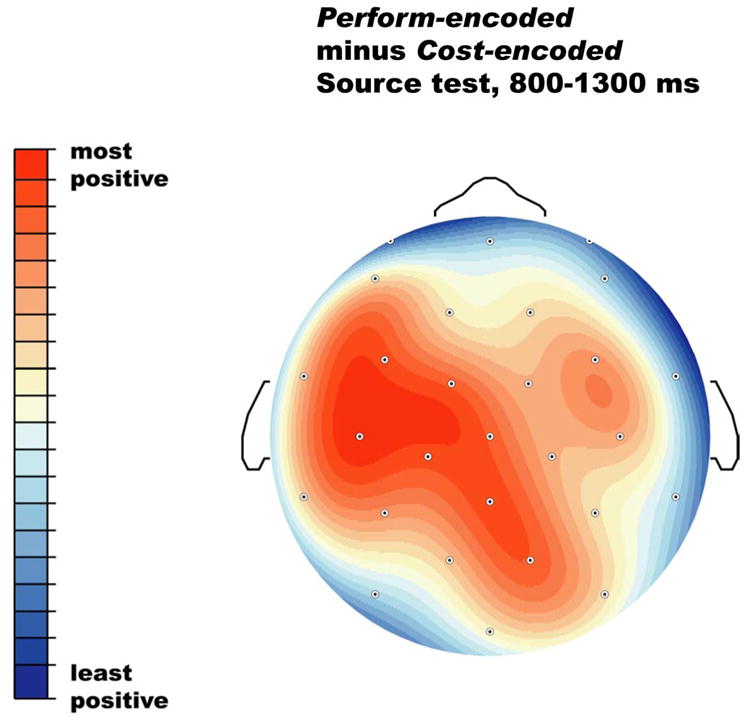
Scalp distribution of the difference between Perform-encoded and Cost-encoded objects during the source memory test. The topographic map has been scaled (normalized) to the range of amplitudes across sites, so that red reflects the largest (most positive) difference and blue the smallest (least positive) difference.