Figure 2.
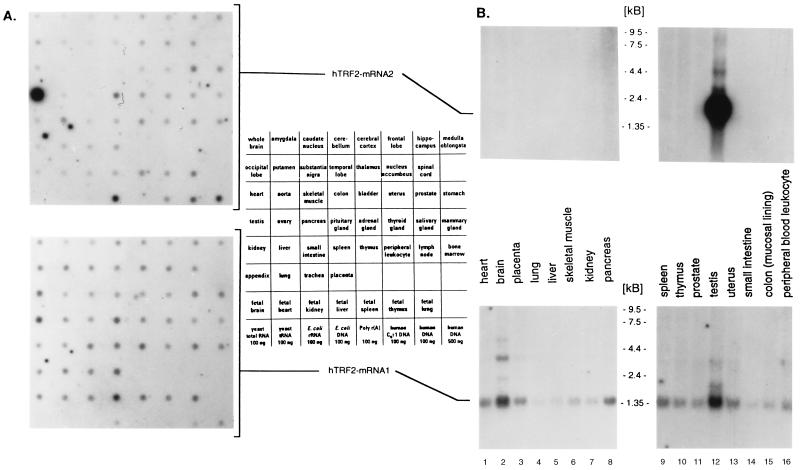
Analysis of hTRF2 mRNA expression. (A) RNA blot for hTRF2-mRNA2 (Upper) and hTRF1-mRNA1 (Lower). RNAs were detected on a Masterblot (as specified by CLONTECH) by using radioactive probes (labeled according to Amersham International megaprime DNA labeling system manual) corresponding either to bp 53,400–53,555 of clone 73H22 (hTRF2-mRNA2) or bp 52,702–52,879 of clone 73H22 (hTRF2-mRNA1). The individual tissue distribution on a Masterblot is schematically drawn (Right). The cDNAs were amplified by PCR by using appropriate ESTs as template DNA. (B) The Northern blot for hTRF2-mRNAs 1 (Upper) and 2 (Lower) on multiple tissue RNA membranes (CLONTECH). The cDNA probes and procedures employed were as described in A.

