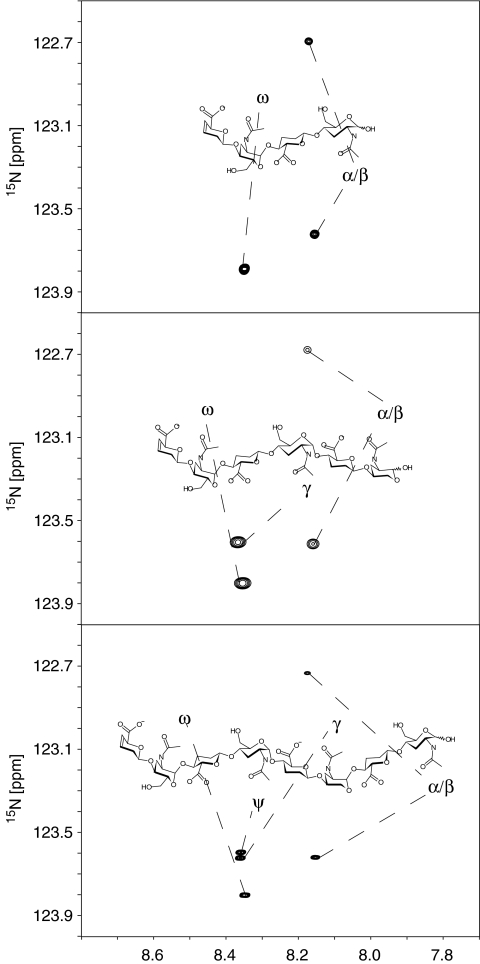
Fig. 2.
15N-1H HSQC spectrum of the tetra-, hexa- and octa-saccharides (from top to bottom) of the NA-domain of heparan sulfate at a proton-resonant frequency of 900 MHz. The abscissa shows 1H chemical shift [ppm]. Labels on the spectrum correspond to amide groups, labeled according to their position within the oligosaccharide, using Greek nomenclature. Variability in the line shapes are due to acquisition and processing of the NMR spectra

