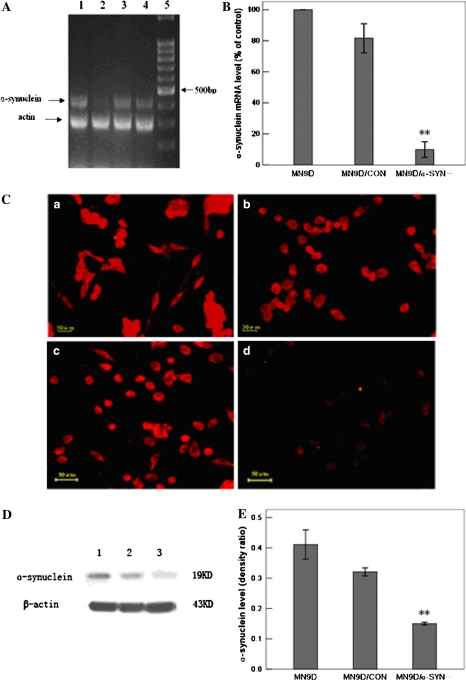
Fig. 1.
Inhibition of α-synuclein expression in pSH2/α-SYN-transfected cells. (a) α-Synuclein mRNA levels were measured by RT-PCR. Lane 1 pSH1/α-SYN-transfected MN9D cells; Lane 2 pSH2/α-SYN-transfected MN9D cells; Lane 3 pSH/CON-transfected MN9D cells; Lane 4 MN9D cells; Lane 5 100 bp DNA ladder. (b) Statistical analysis of α-synuclein gene expression by real-time RT-PCR. α-Synuclein mRNA levels were decreased by approximately 90% in pSH2/α-SYN-transfected cells compared with normal MN9D cells [n = 5, F = 216.167, df(total) = 14, **p < 0.001 compared with MN9D cells, **p < 0.001 compared with MN9D/CON cells]. α-Synuclein mRNA levels were not significantly different in pSH1/α-SYN-transfected cells compared with MN9D and MN9D/CON cells. (c) Immunofluorescence staining of normal MN9D cells (a) and MN9D cells transfected with pSH1/α-SYN (b), pSH/CON (c) and pSH2/α-SYN (d) using an antibody against α-synuclein. Strong α-synuclein staining was observed in MN9D, pSH1/α-SYN-transfected and pSH/CON-transfected MN9D cells, whereas weak staining was observed in pSH2/α-SYN-transfected MN9D cells. Bar = 50 μm. (d) Western blot analysis of α-synuclein protein levels. Lane 1 MN9D cells; Lane 2 MN9D/CON cells; Lane 3 MN9D/α-SYN− cells. (e) Statistical analysis of α-synuclein protein levels in MN9D, MN9D/CON and MN9D/α-SYN− cells using the linear density ratio of α-synuclein/β-actin. α-Synuclein protein levels were significantly decreased in MN9D/α-SYN− cells (0.150 ± 0.004) compared with MN9D (0.401 ± 0.038) and MN9D/CON (0.321 ± 0.011) cells [n = 5, F = 162.034, df(total) = 14, **p < 0.001 compared with MN9D cells, **p < 0.001 compared with MN9D/CON cells]

