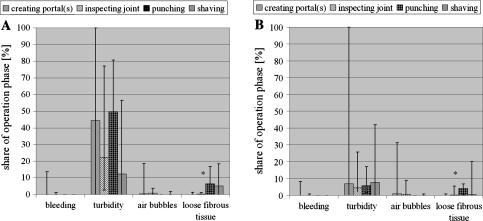
Fig. 3.
Results of the share of disturbances in the arthroscopic view as percentage of the phase time for each operation in the gravity pump group (a), and the automated pump group (b). The results are presented with the median, minimum, and maximum numbers, because the datasets were not distributed normally. *The Mann–Whitney U test shows only a significant difference for loose fibrous tissue in both pump groups

