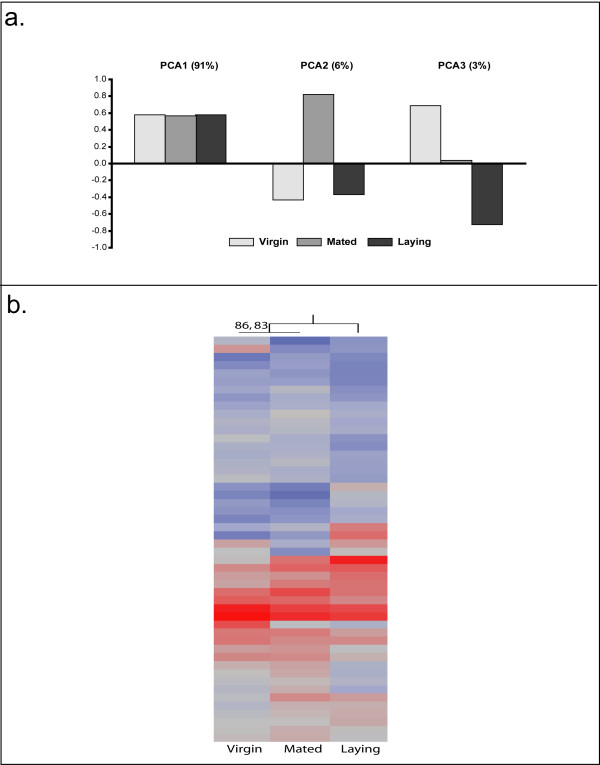
Figure 3.
Analysis of Brain Gene Expression. a. Principal component analysis of the significantly-regulated genes revealed three major patterns of changes occurring within the brain. The first principal component accounts for 91% of the variation and shows little difference between the three groups, while the second principal component accounts for 6% of the variation, with the virgin and laying groups resembling each other and the mated group as the extreme. The final principal component accounts for 2% of the overall variation, and demonstrates that virgin and laying queens are at two extremes with mated queens intermediate. b. Hierarchical clustering analysis was employed to determine if there was a significant clustering structure among the 50 most-predictive transcripts in the brain. Virgin and mated queens grouped together with laying queens as the outgroup. This grouping is supported by an "approximately-unbiased" p-value of 86 and a bootstrap value of 83, and shares the same pattern observed in behavior and mandibular gland profiles.

