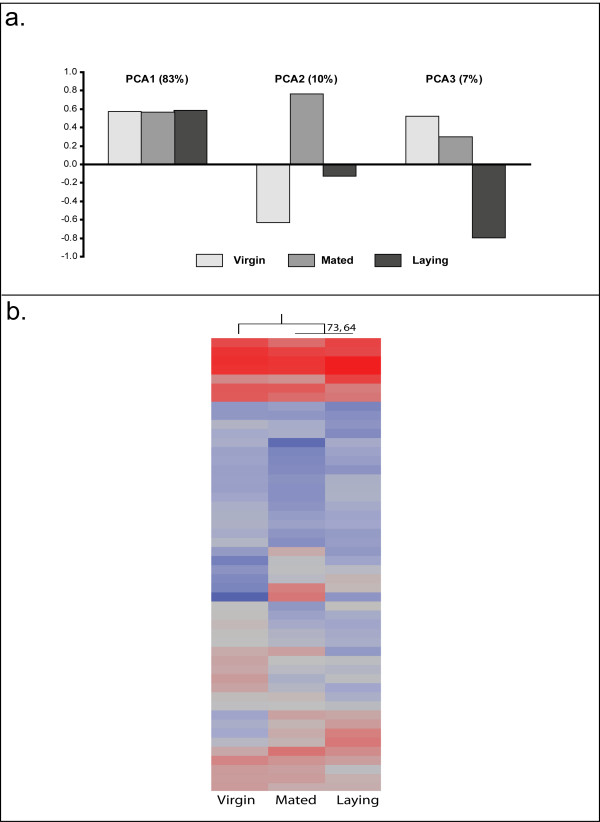
Figure 4.
Analysis of Ovary Gene Expression. a. Principal components analysis of transcript profiling in the ovaries demonstrated similar patterns as the brain. The first principal component accounts for 83% of the variation, and shows little differences among groups. The second principal component accounts for 10% of the overall variation and demonstrates that mated queens represent an extreme phenotype. The final principal component explains 7% of the variation, and identifies laying queens as the outgroup. b. Hierarchical clustering of the 50 most-predictive transcripts in the ovaries reveals that mated and laying queens have transcriptional profiles more similar to each other than to virgins. This grouping is supported by an "approximately-unbiased" p-value of 73 and a boostrap value of 64, and reflects the same patterns observed in ovary development and vitellogenin levels.

