Figure 3.
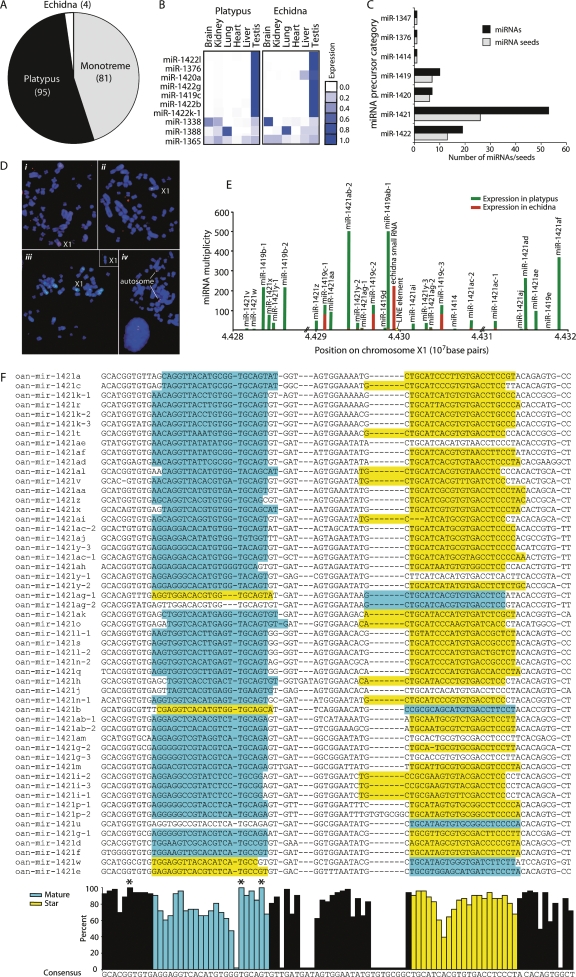
Novel microRNAs in monotremes. (A) Pie graph of monotreme species distribution of 180 novel miRNAs. Eighty-one miRNAs were sequenced in both platypus and echidna small (gray); 95 were only in platypus (black); and four were cloned only in echidna (white), although their sequences were present in the platypus genome. (B) Novel miRNA tissue expression profiles. The expression score represented by blue squares is a ratio of the number of normalized reads in that tissue versus all tissues in that organism. Expression data for 10 of the most highly expressed novel miRNAs is shown. (C) Testis miRNA classification. Ninety-two novel miRNAs were highly expressed in testis and were derived from one of seven related hairpin precursors. The number of miRNAs and miRNA seed sequences derived from each precursor category is shown. (D) Five out of nine contigs containing testis-expressed novel miRNAs map to X1q. Fluorescence in situ hybridization with BAC and Fosmid clones containing miRNA clusters on male platypus metaphase chromosomes. (i) BAC 175h10 from contig 8388 (green) and BAC 273L19 from contig 7359 (red) on the long arm of X1. (ii) Colocalization of BAC 175h10 from contig 8388 (green) and BAC 272K3 from contig 22,847 (red) on X1q. (iii) Localization of Fosmid 0879F15 from contig 7160 (green) on X1q. (Insert) Localization of Fosmid 1002L21 (contig 11,344) on X1q. (iv) BAC clones 686C10 (green) and 802P20 (red) from contig 1754 map to a metacentric autosome. (E) Novel testis-expressed chromosome X1 miRNA cluster. Only small RNAs that map to the genome three times or less are shown. The cloning frequency divided by the number of genome matches for each miRNA is represented by a bar. Platypus miRNAs are plotted in green, echidna in red; platypus and echidna bars are independent and not additive. Gaps in the genome assembly are shown by //. A LINE element insertion that disrupted an echidna small RNA precursor is represented in yellow. (F) Orientation and sequence conservation of 53 miRNAs derived from the miR-1421 group of precursors. Multiple sequence alignment of 53 miR-1421 precursors with the sequence of the mature miRNA highlighted in blue and the miRNA star in yellow. The percent of nucleotides in the alignment that match the consensus for each position is graphed below. Perfectly conserved nucleotides are marked with an asterisk (*).

