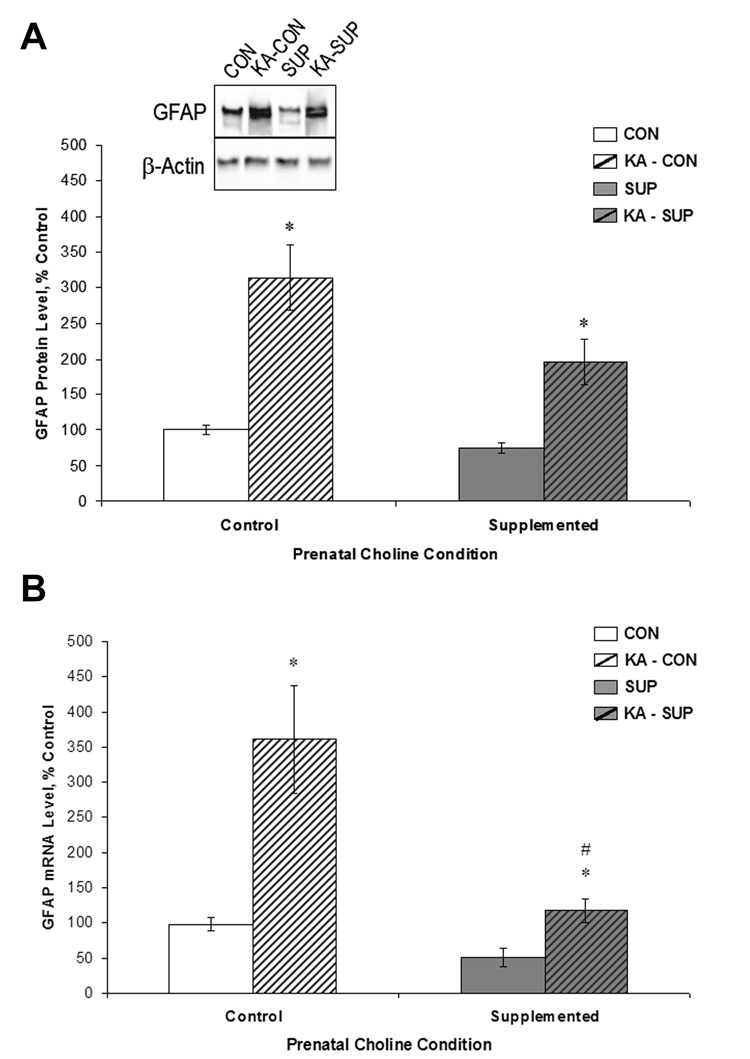
Figure 7.
Comparison between CON (white bars) and SUP rats (grey bars) in GFAP protein levels (A) and mRNA levels (B) (mean ± SEM percent of control levels) in the intact hippocampus (open bars) and 16 days following KA-induced SE (hatched bars). GFAP protein levels were quantified using Western blot analysis (A). SE significantly increased GFAP protein and mRNA levels in both CON and SUP rats (ps < .05), but this increase was significantly attenuated in SUP rats. * statistically different from within-diet saline-treated group; # statistically different from KA-treated CON.

