Figure 3.
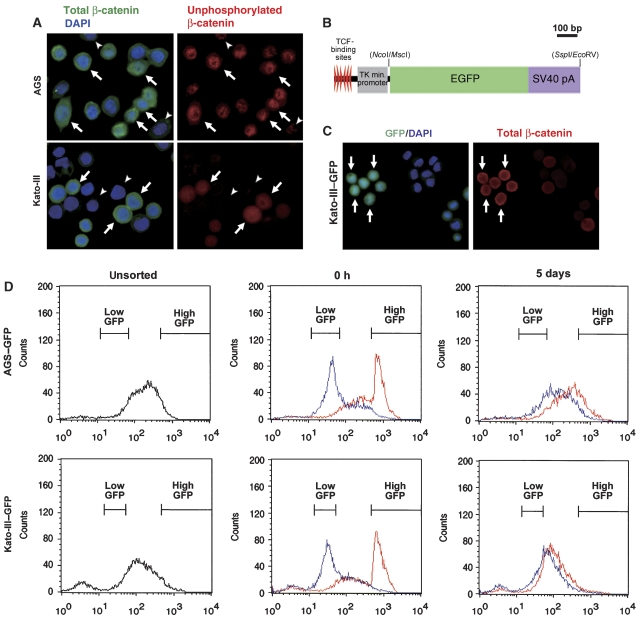
Fluctuation of the Wnt/β-catenin activity in gastric cancer cells. (A) Representative results of immunocytochemistry of AGS (top panels) and Kato-III (bottom panels) using anti-total β-catenin antibody (green) and DAPI (blue) (left panels) or anti-unphosphorylated β-catenin antibody (red) (right panels) of the same specimen. The arrows indicate cells with accumulated both total and unphosphorylated β-catenin. The arrowheads indicate cells with weak or loss of β-catenin staining. (B) Construction of TOPEGFP expression vector. EGFP cDNA was inserted between TCF-binding site/TK minimum promoter and SV40 pA signal. (C) Representative results of immunocytochemistry of Kato-III–GFP cells transiently transfected with pcDNA3-S33A-β-catenin for 72 h. GFP expression (green) with DAPI staining (blue) (left panel), and unphosphorylated β-catenin (red) of the same specimen (right panel) are shown. The arrows indicate the cell cluster with elevated GFP and unphosphorylated β-catenin levels. (D) Representative results of flow cytometry for GFP fluorescence of AGS–GFP (top) and Kato-III–GFP (bottom) cells. Flow cytometry results of the isolated high-GFP (top 5%, red line) and low-GFP (bottom 5%, blue line) populations at 0 h (centre) and 5 days (right) after isolation by cell sorting.

