Figure 2.
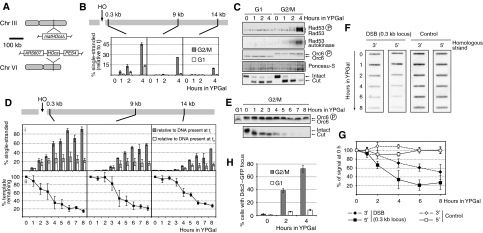
Analysis of DSB processing and checkpoint activation. Cells of strains YCZ101 (1cs, ARS607::HOcs matHOcsΔ, panels B and C), YCZ70 (1cs, ARS607::HOcs matHOcsΔ DDC2-GFP, panel H) and YHHD180 (2cs, ARS607::HOcs, panels D–G) were used. (A) Overview of the strain used. (B) Analysis of ssDNA formation. (C) Immunoblot, Rad53 autokinase assay and ARS607::HOcs DSB assay by Southern blot analysis. Note that in the Southern blot panel, the disappearance of the band corresponding to the cut locus is due to DSB processing. (D, E) Analysis of DSB processing in a longer G2/M experiment: (D) quantification of DSB processing; (E) immunoblot and DSB assay of the experiment shown in panel D. (F, G) Denaturing slot blot analysis confirming the instability of both strands at a DSB: (F) results from one representative experiment; (G) quantifications of the results. (H) Analysis of Ddc2–GFP focus formation.

